A Closer Look At Statistical Analysis
The Godfather of Sport Analytics

Historically, the figure most widely recognized as the father of sports analytics is Henry Chadwick, credited with inventing the baseball box score and laying the foundation for modern statistical analysis in sports.
Chadwick was a 19th‑century cricket reporter who became fascinated with baseball. In the mid‑1800s, he created: The box score, Batting average, Earned run average (ERA), Other early statistical tools still used today
Football
Paul Brown wasn’t just a great coach — he was the first to treat football like a measurable system.
His innovations directly led to: Film‑based analytics, Scouting combine metrics, Play‑tendency analysis, Player grading systems, Structured practice data
Modern analytics departments still use frameworks he created. “Paul Brown didn’t have computers, but he invented the mindset — grading every play, charting tendencies, timing players, and turning football into a measurable science."
Baseball
Basketball

Sabermetrics coined by Bill James in the 1980s, led to the Moneyball‑era analytics of the Oakland A's. Applied by Billy Beane and Paul DePodesta in the early 2000s, they created the explosion of data‑driven decision‑making across all sports.
While Bill James is often called the father of modern analytics, and Billy Beane popularized analytics culturally for Major League Baseball and other levels of the game.
Basketball
Basketball

Basketball never had a single father of analytics, but John Hollinger is the modern pioneer, Harvey Pollack expanded the stats, and today’s tracking‑and‑AI era has transformed the sport through one person: Dean Oliver.
He transformed basketball analytics by turning box‑score thinking into a practical, decision‑focused framework; his 2002 book, "Basketball on Paper" and subsequent NBA and media roles made advanced metrics part of how teams evaluate players and strategy.
Sports Analytics Mt. Rushmore
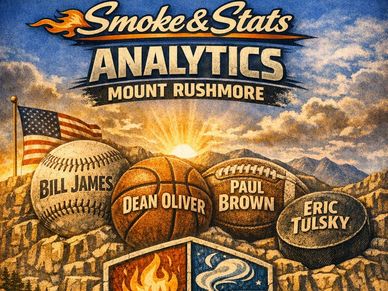
“If you carve a Mount Rushmore for sports analytics, you start with Bill James rewriting baseball, Dean Oliver building basketball’s blueprint, Paul Brown turning football into a measurable science, and Eric Tulsky dragging hockey into the data age. Four sports, four revolutions, one analytics mountain.”
Analytics don’t tell you what to do. They explain why things happened and help you understand the forces underneath performance.
Hockey

Eric Tulsky is known for translating scientific rigor into hockey decision‑making — pioneering possession and controlled‑entry analysis, building the Carolina Hurricanes’ analytics department.
He moved from publishing analysis online and speaking at conferences to consulting for teams, then joining the Carolina Hurricanes full time and building their analytics group — a path that culminated in senior hockey‑operations roles.
More Smoke and Stats Analytical Stuff
Edwin Moses Training via Analytics
Why Usain Bolt's Record Still Stands
Why Usain Bolt's Record Still Stands

Why Edwin Moses’ 13‑step pattern was analytics
Moses didn’t stumble into the 13‑step rhythm because he “felt” it. He measured, modeled, and optimized it.
He was a physics and engineering major, and he approached hurdling like an engineer:
• He analyzed stride length vs. hurdle spacing
• He calculated optimal takeoff angles
• He tested rhythm patterns
• He used his height and mechanics to maintain constant velocity
That’s analytics — not in spreadsheets, but in movement.
He essentially built a data‑driven solution to a problem no one else had solved:
“How do you eliminate the speed loss between hurdles?”
The answer:
A consistent 13‑step pattern that kept his center of mass stable and his rhythm unbroken.
Why Usain Bolt's Record Still Stands
Why Usain Bolt's Record Still Stands
Why Usain Bolt's Record Still Stands
Why his times haven’t been matched
There are several non‑doping explanations that experts point to:
• His height + stride length created a unique mechanical advantage.
• His top‑end speed phase lasted longer than any sprinter ever recorded.
• His reaction times were elite despite his size.
• His competition era didn’t produce another generational sprinter at his level.
• His coach (Glen Mills) built a system around maximizing Bolt’s unusual body type.
In other words:
He was a biomechanical outlier in a way that’s extremely rare.
Usain Bolt was so far ahead of the field that people still debate how he did it. Some folks look at that gap and raise an eyebrow, but the only thing we can say for sure is that he was a once‑in‑a‑generation biomechanical outlier who never failed a test. The mystery is part of what keeps his legend alive.
Four Factors of Martial Arts
Why Usain Bolt's Record Still Stands
Where Fire Meets Formula on the Ice
1. Physical Capacity (Engine & Durability)
This covers the raw physical tools a fighter brings into the cage or dojo.
Research shows physical conditioning is one of the core pillars of martial‑arts performance.
Why it matters: Without the engine, the rest of the system collapses.
2. Technical Skill (Tools & Craft)
This is the fighter’s technical proficiency — striking mechanics, grappling fundamentals, footwork, transitions, and defensive technique.
Why it matters: Technique determines what options you can use under pressure.
3. Mental Readiness (Composure & Adaptability)
Mental preparation is identified as a key determinant of success in high‑level martial arts.
Why it matters: A fighter with a strong mind can execute their game even when the fight gets messy.
4. Tactical Intelligence (Strategy & Decision‑Making)
This is the fighter’s ability to read opponents, adjust mid‑fight, manage distance, pace, and choose the right tool at the right time.
Why it matters: This is where fights are won — not by having more moves, but by choosing the right ones.
Where Fire Meets Formula on the Ice
Where Fire Meets Formula on the Ice
Where Fire Meets Formula on the Ice
1. HEAT → Chance Creation & Pressure Rate
What it measures:
How consistently a team ignites offense — generating dangerous chances, forcing defensive breakdowns, and sustaining pressure.
Core metrics:
• Expected Goals For (xGF)
• High‑Danger Chances For (HDCF)
• Offensive Zone Possession Time
• Forecheck Pressure Rate
Why it’s “Heat”:
It’s the spark. The ignition. The force that raises the temperature in the offensive zone.
2. SMOKE → Flow, Movement, & Influence on the Ice
What it measures:
How a team shapes the environment — controlling the flow of play, dictating movement, and influencing where the puck goes.
Core metrics:
• Controlled Zone Entries & Exits
• Transition Efficiency
• Passing Network Centrality
• Shot Assist Rate
Why it’s “Smoke”:
Smoke drifts, spreads, and reshapes the space — just like elite puck movement and transition play.
3. TIME → Repeatability, Durability, & Goaltending Stability
What it measures:
The ability to sustain performance over long stretches — especially in net.
Core metrics:
• Goals Saved Above Expected (GSAx)
• Defensive Structure Repeatability
• Shift Length Efficiency
• Fatigue‑Adjusted Performance
Why it’s “Time”:
Hockey is a grind. The teams that win are the ones whose structure and goaltending hold up over time.
4. SURFACE → Puck Control, Edges, & Micro‑Skill Efficiency
What it measures:
Mastery of the ice itself — skating, edges, puck control, and micro‑skills that tilt possession.
Core metrics:
• Puck Retrieval Success
• Edgework Efficiency (tracking‑based)
• Board Battle Win Rate
• Controlled Carry‑Through‑Traffic Rate
Why it’s “Surface”:
Hockey is played on a literal surface — and the teams that master it dominate the micro‑battles that decide games.
Four Factors of Soccer
Where Fire Meets Formula on the Ice
Four Factors of Soccer
1. HEAT → Chance Creation & Expected Threat (xT/xG) What it measures:
How a team ignites danger — the volume and quality of chances they generate.
Core metrics:
• Expected Goals (xG)
• Expected Threat (xT) progression
• Final‑third entries
• Big Chances Created
• Shot assists & key passes
Why it’s Heat:
It’s the spark. The ignition point. The moment the match temperature rises.
2. SMOKE → Possession Influence, Shape, & Spatial Control
What it measures:
How a team reshapes the environment — dictating space, tempo, and movement.
Core metrics:
• Field Tilt (possession in attacking third)
• Pass Network Centrality
• Press Resistance
• Zone Occupation Maps
• Controlled Possession Chains
Why it’s Smoke:
Smoke drifts, spreads, and fills the pitch — just like elite positional play.
3. TIME → Repeatability, Defensive Stability, & Match Management
What it measures:
The ability to sustain performance over 90 minutes and across a season.
Core metrics:
• Expected Goals Against (xGA)
• Defensive Actions per 90 (DAp90)
• Pressing Duration & Intensity Decay
• Game State Performance (leading/tied/behind)
• Fatigue‑adjusted metrics
Why it’s Time:
Soccer is a long‑form endurance test. The teams that win are the ones whose structure holds up over time.
4. SURFACE → Technical Efficiency, Touch Quality, & Micro‑Skill Control
What it measures:
Mastery of the playing surface — the micro‑skills that decide tight matches.
Core metrics:
• First‑touch retention
• Dribble success under pressure
• Ball‑winning efficiency
• Tight‑space control
• Ground duel win rate
Why it’s Surface:
Soccer is played on a literal surface — and the teams that dominate the micro‑battles dominate the match.
Four Factors of Boxing
Where Fire Meets Formula on the Ice
Four Factors of Soccer
1. HEAT → Offensive Pressure & Damage Creation
What it measures:
How a fighter ignites the action — the ability to create danger, force reactions, and land meaningful shots.
Core metrics:
• Power‑punch damage rate
• Pressure sequences per round
• Forced defensive reactions
• Clean‑impact percentage
• Momentum swings created
2. SMOKE → Ring Generalship, Feints, & Control of Exchanges
What it measures:
How a fighter shapes the environment — dictating where, when, and how exchanges happen.
Core metrics:
• Feint effectiveness
• Exchange control percentage
• Opponent displacement (footwork influence)
• Jab‑to‑reaction ratio
• Positional advantage time
3. TIME → Round Management, Pace Control & Durability
What it measures:
How a fighter performs over the long arc of a bout — managing energy, momentum, and round‑winning sequences.
Core metrics:
• Round‑winning sequences
• Pace control index
• Fatigue‑adjusted accuracy
• Damage absorption stability
• Late‑round performance delta
4. SURFACE → Footwork, Balance, Defense & Micro‑Skill Efficiency
What it measures:
Mastery of the canvas — the micro‑skills that separate elite fighters from everyone else.
Core metrics:
• Balance retention under fire
• Defensive efficiency (slips, parries, rolls)
• Footwork economy
• Angle creation rate
• Counter‑window exploitation
The fighter who controls the canvas controls the fight.